The Kinematics Tool
1 Introduction
The Kinematics Tool generates tables and graphs of positions, velocities, and angular velocities of selected points as a function of time. Although GPlates can also calculate and export positions and velocities through the Export functionality, the Kinematics Tool lets users quickly generate graphs and tables with just a few mouse clicks.
2 Opening the Kinematics Tool
The Kinematics Tool is opened through the Utilities→Open Kinematics Tool menu item (shortcut Shift+Ctrl+K)
3 Providing position, plate-id and time information
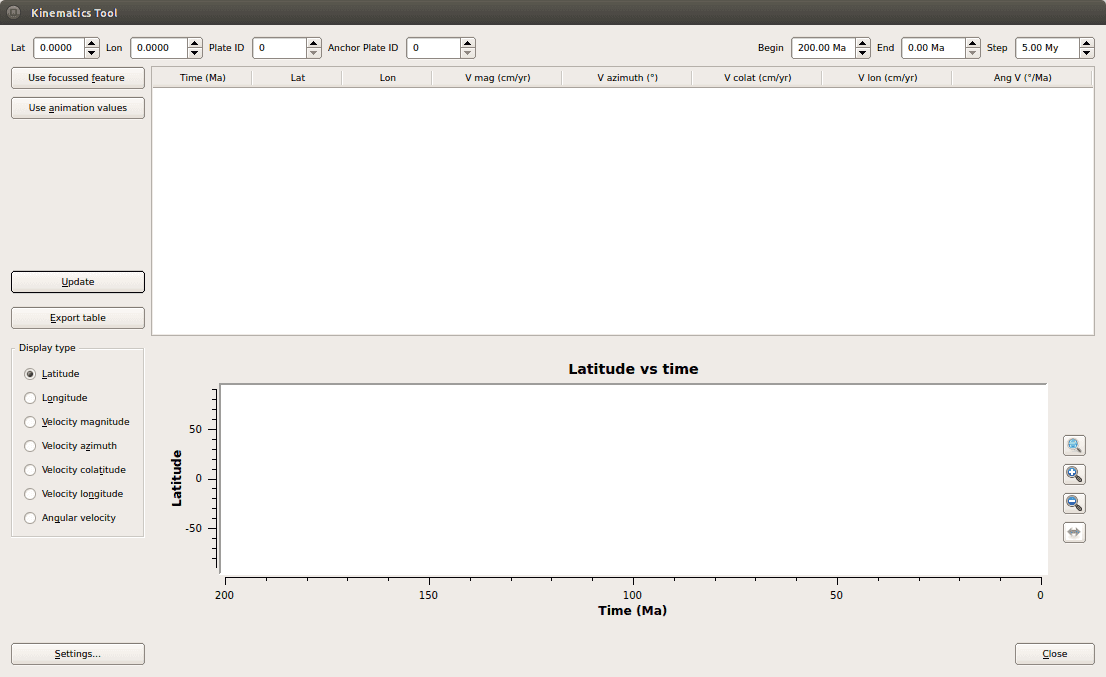
Fill in the spinboxes at the top of the dialog with latitude, longitude and plate-id of the point which you would like to examine the motion of, and provide a range of times and a time-interval in the Begin, End and Step spinboxes.

|
The time step provided here determines the points in time at which the velocity calculations will be performed. This does not change the time interval (Δt) used in the velocity calculation. By default Δt is 1My, but can be changed in the Settings dialog (see below). |
|
|
If you have selected a feature on the canvas (see the Interacting With Features chapter), you can fill the latitude, longitude and plate-id fields automatically by pressing the Use focussed feature button. |
|
|
If the desired time settings coincide with those in the animation settings (see the Reconstructions chapter), you can import these to the Kinematics Tool by pressing the Use animation values button. |
4 Viewing the results
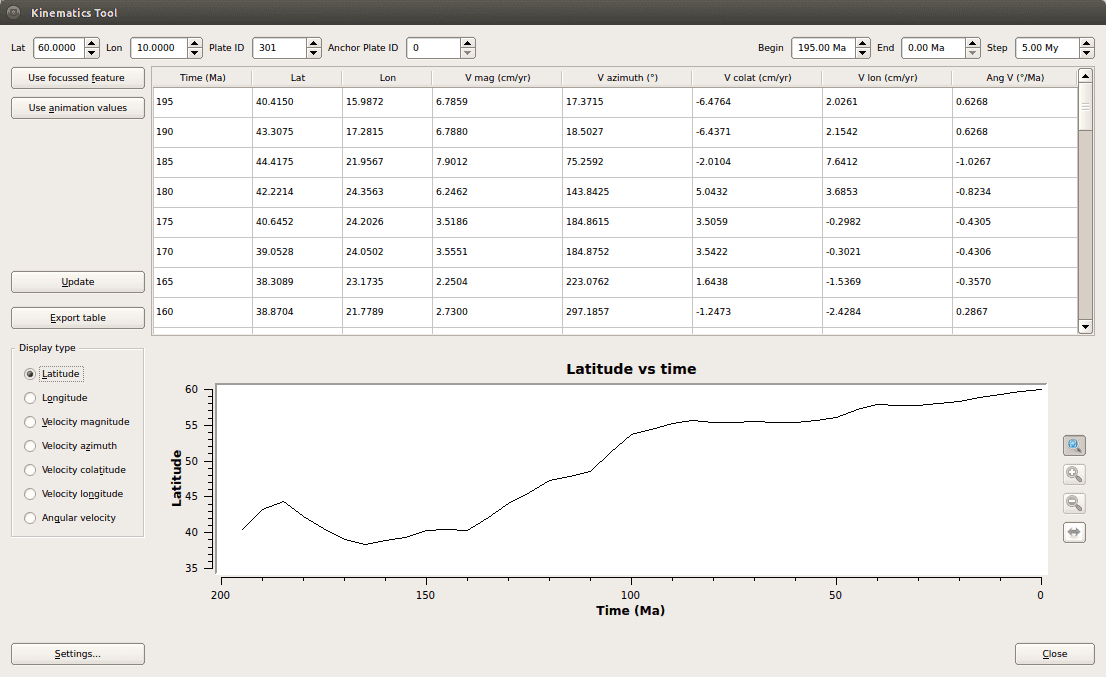
Press the Update button, and the table will be filled with position and velocity-related data for each time step, and a graph of latitude against time will be displayed in the graph window. Change the graph type by using the Display type radio-buttons to the left of the graph window.
|
|
The vertical graph axis can be adjusted by using the autoscale, stretch and compress buttons to the right of the graph window. The horizontal (time) axis can be flipped by using the flip horizontal axis button. |
5 Exporting the results
To export the table to file, press the Export button and select the desired output filename and file format.
6 Settings
The time-intervals used in the velocity calculations can be adjusted by pressing the Settings button and changing the fields in the Settings window.
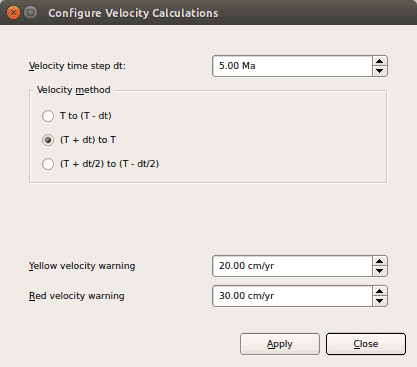
This dialog also allows you to set two velocity warning levels. Velocities exceeding these levels will be highlighted in the table in yellow and red colours.
|
|
If you want to store these values so that they are used on start-up of subsequent GPlates sessions, you can do this through the Preferences dialog. From the main GPlates window, select Edit→Preferences (shortcut Ctrl+,) and adjust the values in the Kinematic Graphs pane. |
|
|
|


